
Mastering Node Placement in RGraphviz
When working with complex network graphs in R, positioning nodes precisely can be a challenge. Using the RGraphviz package, we can leverage the pos attribute to manually fix node placements. However, many users struggle to apply this attribute correctly, especially in neato layouts. 🧐
Graph visualization tools are essential for data analysis, machine learning, and Bayesian networks. Often, automatic layouts create overlapping arcs, making interpretation difficult. This is where manually setting positions becomes useful. But how can we ensure that our adjustments remain robust and reproducible?
Imagine building a network diagram where each node represents a key step in a decision-making process. If nodes shift unexpectedly, the entire visualization loses its clarity. By properly implementing the pos argument, we can lock nodes in place, ensuring consistent layout and readability. 📌
This article explores the correct way to use the pos attribute in RGraphviz. We'll look at practical examples, common mistakes, and a potential workaround for achieving a well-structured graph layout. Ready to take control of your visualizations? Let’s dive in! 🚀
| Command | Example of use |
|---|---|
| agopen() | Creates a graph object for visualization using RGraphviz. It prepares the graph layout, including attributes like node positions. |
| amat() | Assigns an adjacency matrix to a Bayesian network object in bnlearn, defining the structure of the graph. |
| igraph.from.graphNEL() | Converts a graphNEL object (used in Rgraphviz) into an igraph object for easier manipulation. |
| norm_coords() | Normalizes coordinate values within a specified range, ensuring uniform graph layouts and better visualization. |
| layout.grid() | Generates a grid-based layout for graph nodes, helping in structuring the visualization in an ordered way. |
| agwrite() | Exports the graph structure into a DOT file format, allowing for external manipulation or rendering using Graphviz. |
| readLines() | Reads the content of a DOT file into R as a character vector, enabling modifications to node attributes. |
| grep() | Searches for specific patterns (e.g., node labels) within the DOT file to locate where modifications should be applied. |
| gsub() | Replaces existing node attributes within the DOT file with new position values to lock node placements. |
| system("neato ...") | Executes the neato command from Graphviz to render the modified DOT file into a visual output (e.g., PDF). |
Understanding Node Positioning in RGraphviz
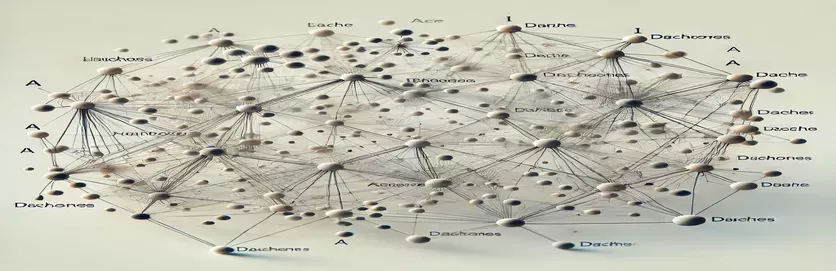
One of the challenges in graph visualization is ensuring that nodes and edges are placed in a way that maximizes readability. In the provided scripts, we use RGraphviz to define a structured layout, preventing nodes from shifting unpredictably. The first script initializes a directed graph using an adjacency matrix, defining the relationships between nodes. The bnlearn and igraph libraries help convert this matrix into a format compatible with RGraphviz, allowing us to visualize structured networks such as Bayesian graphs. 📊
To manually define node positions, we extract layout coordinates and apply the pos attribute. The layout.grid function ensures that nodes align neatly in a structured format, while norm_coords scales coordinates to fit within a predefined space. This prevents unwanted overlaps and enhances clarity. The challenge arises when attempting to apply these positions using the agopen function, as the default settings of RGraphviz may override manually set coordinates. A common mistake is assuming that providing a named list of positions is sufficient, but without setting the pin attribute to TRUE, the layout engine may reposition the nodes dynamically.
The alternative approach circumvents this issue by directly modifying the DOT file. By exporting the graph structure with agwrite, we gain access to the underlying node definitions. The script then scans the DOT file for node labels and inserts manually defined positions. Using gsub, we replace existing labels with the formatted position attributes, ensuring nodes remain fixed. Finally, we use the neato command-line tool to render the adjusted graph, preserving the desired structure. This approach, while effective, requires additional file manipulation steps and may not be the most streamlined solution. 🛠️
In practical applications, such as visualizing social networks or decision trees, fixing node positions is essential for maintaining meaningful relationships between elements. For example, in a workflow diagram, placing nodes dynamically may distort dependencies, making it harder to interpret the process flow. By leveraging RGraphviz effectively, we can produce well-organized visualizations that remain consistent across different rendering environments. Understanding these techniques ensures better control over complex network structures and enhances the clarity of our data-driven insights.
Fixing Node Positions in RGraphviz with the pos Attribute
Implementation of node positioning in RGraphviz using R programming language
# Load necessary librarieslibrary(bnlearn)library(Rgraphviz)library(igraph)# Create an adjacency matrix for a graphadj <- matrix(0L, ncol=9, nrow=9, dimnames=list(LETTERS[1:9], LETTERS[1:9]))adj[upper.tri(adj)] <- 1# Convert adjacency matrix to graphNEL objecte <- empty.graph(LETTERS[1:9])amat(e) <- adjg <- as.graphNEL(e)# Define layout positionsig <- igraph.from.graphNEL(g)lay <- layout.grid(ig)lay <- setNames(data.frame(norm_coords(lay, -100, 100, -100, 100)), c("x", "y"))# Set positions in RGraphvizrownames(lay) <- nodes(e)pos <- lapply(split(lay, rownames(lay)), unlist)# Create graph with fixed positionsz <- agopen(g, "gg", nodeAttrs=list(pos=pos, pin=setNames(rep(TRUE, length(nodes(e))), nodes(e))), layoutType="neato")
Alternative Approach: Using DOT File Manipulation for Fixed Node Placement
Alternative implementation using DOT file for RGraphviz positioning
# Generate an RGraphviz objectz <- agopen(g, "gg")agwrite(z, "graph.dot")# Extract and modify positionslay1 <- do.call(paste, c(lay, sep=","))pos <- paste('pos = "', lay1, '!"')# Read and modify DOT filerd <- readLines("graph.dot")id <- sapply(paste0("label=", nodes(e)), grep, rd)for (i in seq(id)) {rd[id[i]] <- gsub(names(id)[i], paste(names(id)[i], pos[i], sep="\n"), rd[id[i]])}# Output and render with fixed positionscat(rd, file="fixed_graph.dot", sep="\n")system("neato fixed_graph.dot -n -Tpdf -o output.pdf")
Optimizing Node Placement in RGraphviz for Complex Networks
When working with RGraphviz, one often encounters challenges in arranging nodes optimally within a visualization. While the pos attribute allows manual positioning, additional refinements can enhance the clarity and efficiency of graph layouts. One such method is using edge weight adjustments to influence automatic layouts. By setting higher weights on critical connections, we can guide the algorithm to prioritize their placement, reducing unnecessary overlaps.
Another effective technique is the use of subgraphs to control node clustering. By grouping related nodes into subgraphs, RGraphviz treats them as a single unit, maintaining relative positions while optimizing spacing. This is particularly useful in Bayesian networks or hierarchical structures where certain nodes must remain logically connected. Additionally, using constraints such as rank=same in DOT files ensures that specified nodes align on the same level, improving readability.
Lastly, combining RGraphviz with external libraries like ggplot2 can enhance visual customization. While RGraphviz handles the structural layout, ggplot2 allows additional styling, labels, and interactive elements. This hybrid approach is especially useful for presenting complex networks in reports or interactive dashboards, providing both structure and aesthetic appeal. By integrating these methods, we can achieve high-quality, well-organized network diagrams tailored to specific analytical needs. 📊
Common Questions on Node Positioning in RGraphviz
- How do I prevent nodes from overlapping in RGraphviz?
- Set the attribute pin=TRUE while defining positions using pos, or use neato with predefined coordinates.
- Can I manually adjust the curve of overlapping edges?
- Yes, you can modify the splines attribute in the DOT file to control edge curvature dynamically.
- What is the best layout type for structured graphs?
- For hierarchical graphs, use dot; for force-directed layouts, neato is more suitable.
- How can I ensure nodes stay in fixed positions when rendering?
- Use pos with explicit coordinates and enable pin=TRUE to lock positions.
- Is there a way to apply different colors to nodes based on categories?
- Yes, define node attributes using nodeAttrs=list(fillcolor="red") or modify the DOT file directly.
Enhancing Graph Layouts with Fixed Node Positions
Controlling node positioning in RGraphviz can be challenging, but using the right combination of attributes like pos and pin ensures that nodes remain in place. This prevents distortions in visualized data structures, which is crucial for applications such as social network analysis and decision trees. A structured approach simplifies interpretation and enhances the clarity of relationships within a graph.
For advanced applications, modifying DOT files directly or integrating external styling tools like ggplot2 can further refine graph appearances. By combining these techniques, users gain more control over complex network layouts. Whether for academic research or business intelligence, mastering these methods leads to clearer, more effective data visualizations. 🖥️
Sources and References for RGraphviz Node Positioning
- Documentation on RGraphviz and Graphviz attributes: Bioconductor - RGraphviz
- Official Graphviz attribute reference for node positioning: Graphviz Attributes Documentation
- R bnlearn package for Bayesian networks and graph structures: bnlearn - Adjacency Matrix Documentation
- Stack Overflow discussion on fixing node positions in RGraphviz: Stack Overflow - RGraphviz Node Positioning
- Graph visualization best practices in R: RPubs - Graph Visualization with Graphviz